Stay up to date! Information about air quality in Małopolska in a new version

The air quality information portal has been updated. Now every resident of Malopolska can easily check what the air quality is in the area.
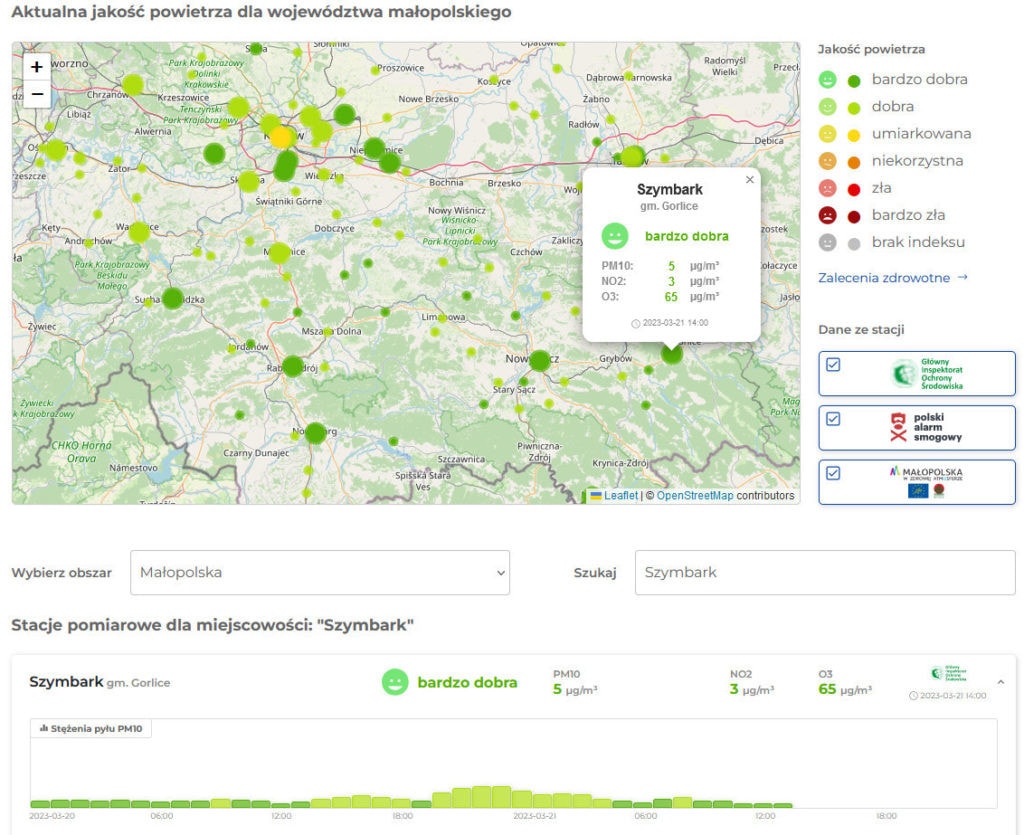
How is air quality determined?
The map on the Małopolska portal includes data from sensors installed throughout the region. The measurements come from the stations of the State Environmental Monitoring conducted by the Chief Inspectorate of Environmental Protection, the Krakow Smog Alarm’s dust meters used as part of the LIFE project, and a new network of sensors installed at schools.
Air quality in Poland is studied all the time. The results are obtained “on-line” and presented as averages for one hour. When studying the composition of the air, attention is largely paid to harmful components . The data collected primarily concern concentrations of PM10, PM2.5, nitrogen dioxide (NO2) and ozone (O3). Concentration levels of selected substances are color coded. Then a kind of “air quality index” is created. It also provides information on whether the air quality is very good or unfavorable. Younger users can read the result using both colors and smileys. Those more inquisitive, can follow the numerical values. In addition, by expanding the data from individual stations, we have access to a graph showing the history of concentrations over the past 24 hours.
Why is it important to check air quality?
We all feel the effects of poor air quality. Headache, burning eyes, scratchy throat are only the least dangerous symptoms that appear. The elderly, people suffering from respiratory and circulatory diseases, pregnant women and small children are particularly vulnerable to the effects of poor air quality. The key to protecting yourself and your loved ones from the harmful effects of smog on our bodies is to check the air quality regularly. This is because awareness of the danger is the first, very important step that can save our health and even the lives of those close to us. We can then plan our activity in such a way that we do not expose ourselves to undesirable consequences. Avoiding intense activity outdoors, not ventilating rooms, turning on an air purifier are just a selection of measures worth taking.
Degrees of danger
Specific atmospheric conditions (high weather and frost) favor the formation of smog. We may encounter a situation where air quality measurements and forecasts indicate the risk of exceeding acceptable levels of pollution. We then see announcements: “Attention: today there will be bad air quality”. In such cases, degrees of air pollution danger are introduced.
Degrees of danger occur when there is a risk of exceeding alert, information, permissible and target levels of substances in the air.
- grade (yellow) means the risk of exceeding the permissible level (50 μg/m3 for PM10).
- grade (orange) is the risk of exceeding the information level (100 μg/m3 for PM10).
- grade (orange) is the risk of exceeding the information level (100 μg/m3 for PM10).
- degree (red) means the risk of exceeding the alert level (150 μg/m3 for PM10).
The higher the degree introduced, the higher the pollution is, and therefore more harmful to health.
These days, remedial short-term measures are being taken, which should lower the levels of pollutant concentrations in the air.
Subscribe to our newsletter
Subscribe to the newsletter. It’s easy! Go to the bottom of the page. When you enter your email address and click on the county you’re interested in, you’ll receive warnings about bad air quality. Stay informed. Raise awareness. Protect yourself and your loved ones. Subscribe to the newsletter so that warnings about poor air quality will arrive at the email address you specify. In addition, you can download a widget that, when placed on the website, will inform you about the current air quality and the introduced air pollution threat levels.